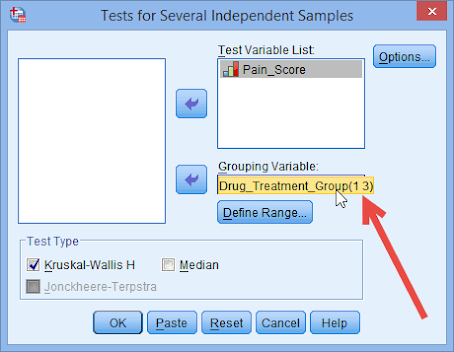
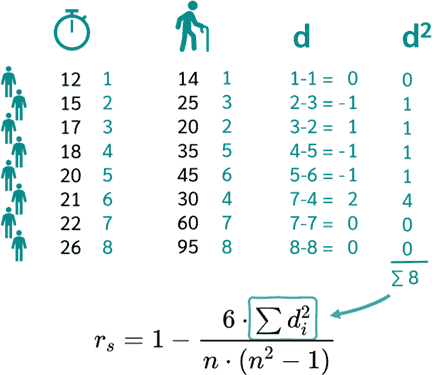
What is Kruskal-Wallis Test?
The Kruskal-Wallis test is a non-parametric test used to compare the medians of two or more independent groups. It is similar to the one-way analysis of variance (ANOVA), but it does not require the assumption of normality in the data.
II. Hypothesis:
Null hypothesis (H0): The medians of the samples are equal.
Alternative hypothesis (Ha): At least one median differs from the others.
III. Assumptions:
The samples are independent.
The distributions of the samples are not necessarily normal.
The data must be ordinal or continuous
No outliers that could significantly affect the results
IV. Procedure:
1. Calculate the ranks of all observations: Assign each observation a rank from 1 to N, where N is the total number of observations. Ties are assigned the average of the ranks they would have received if they were not tied.
2. Calculate the test statistic: The Kruskal-Wallis test statistic (H) is calculated as:
H = (12 / N(N+1)) * Σ(Rj - R)^2
where:
• N is the total number of observations
• R is the sum of the ranks for group j
• R is the overall mean rank
3. Determine the critical value: The critical value for the Kruskal-Wallis test is obtained from a chi-square distribution with (k-1) degrees of freedom, where k is the number of groups being compared.
4. Compare the test statistic to the critical value: If the test statistic is greater than the critical value, then the null hypothesis (that the medians of the groups are equal) is rejected.
V. Interpretation:
• If the p-value is less than the significance level (usually 0.05), then the null hypothesis is rejected, and there is evidence that the medians of the groups are different.
• If the p-value is greater than the significance level, then the null hypothesis is not rejected, and there is not enough evidence to conclude that the medians of the groups are different.
VI. Advantages:
• Non-parametric, so it does not require the assumption of normality.
• Can be used with ordinal or continuous data.
• Robust to outliers.
• Suitable for small sample sizes
VII. Disadvantages:
• Less powerful than the one-way ANOVA when the data is normally distributed.
• Can be sensitive to ties in the data.
• Requires ordinal or continuous data.
VIII. Applications:
Comparing the effectiveness of different treatments
Analyzing the impact of demographic variables on outcomes
Testing for differences in rankings or preferences
IX. Example of Kruskal-Wallis Test Application in Health Science:
1. Objective: To compare the effectiveness of three different exercise interventions on reducing pain in patients with chronic lower back pain.
2. Methods:
Participants: 150 patients with chronic lower back pain
Interventions:
Group A: Traditional physical therapy
Group B: Yoga
Group C: Pilates
3. Outcome: Pain intensity measured on a 10-point Visual Analogue Scale (VAS) at baseline and after 12 weeks of intervention
4. Statistical Analysis:
The Kruskal-Wallis test was used to compare the VAS scores between the three groups. The test is non-parametric, meaning it does not assume a normal distribution of the data, which is appropriate for this type of ordinal outcome.
5. Results:
The Kruskal-Wallis test showed a significant difference in VAS scores between the three groups (p < 0.05).
6. Pairwise Comparisons:
Post-hoc pairwise comparisons using the Mann-Whitney U test revealed the following significant differences:
Group A (Traditional PT) had significantly lower VAS scores compared to Group C (Pilates) (p < 0.05).
There was no significant difference between Group A (Traditional PT) and Group B (Yoga) or between Group B (Yoga) and Group C (Pilates).
7. Conclusion:
The Kruskal-Wallis test and subsequent pairwise comparisons demonstrated that traditional physical therapy (Group A) was more effective in reducing pain intensity in patients with chronic lower back pain compared to Pilates (Group C). However, yoga (Group B) did not show a significant difference in effectiveness compared to either traditional PT or Pilates.
......................................................................................................
👉 For the data analysis,
please go to my Youtube(Ads) channel to Watch Video (Video Link)
in
Youtube
Channel (Channel Link) and Download(Ads) video.
💗 Thanks to
Subscribe(channel) and Click(channel) on bell 🔔 to
get more videos!💗!!
- Tell: (+855) - 96 810 0024
- Telegram: https://t.me/sokchea_yann
- Facebook Page: https://www.facebook.com/CambodiaBiostatistics/
- TikTok: https://www.tiktok.com/@sokcheayann999
- STATA for dataset restructuring, descriptive and analytical data analysis
- SPSS for dataset restructuring, data entry, data check, descriptive, and analytical data analysis
- Epi-Info for building questionnaires, data check, data entry, descriptive, and analytical data analysis
- Epidata-Analysis for dataset restructuring, descriptive and analytical data analysis
- Epi-Collect for building questionnaires, remote data entry, mapping, and data visualization
- Epidata-Entry for building questionnaires, data check, data entry, and data validation
ABA Account-holder name: Sokchea YAN
ABA Account number: 002 996 999
ABA QR Code:
or tap on link below to send payment:
https://pay.ababank.com/iT3dMbNKCJhp7Hgz6
✌ Have a nice day!!! 💞


.png)


Comments
Post a Comment