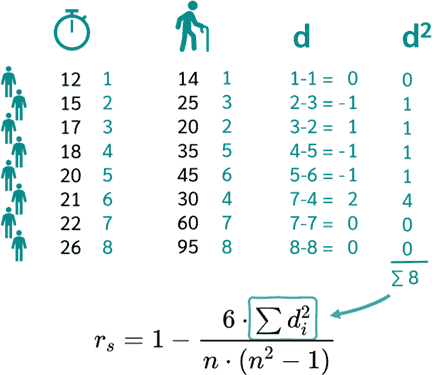
Spearman's Rank Correlation Coefficient (ρ)
Spearman's Rank Correlation Coefficient (ρ)


Spearmans' rank correlation coefficient is a non-parametric measure of the correlation between two variables that examines the relationship between their rankings, rather than their actual values.
Formula:
$$ρ = \frac{\sum{i=1}^{n} (ri - si)^2}{\sum{i=1}^{n} (ri^2 + si^2 - 1)}$$
where:
n is the number of paired observations
ri is the rank of the i-th observation in the first variable
si is the rank of the i-th observation in the second variable
Interpretation:
-1 ≤ ρ ≤ 1
ρ = 1: Perfect positive correlation (rankings of both variables are exactly the same)
ρ = -1: Perfect negative correlation (rankings of the variables are exactly opposite)
ρ = 0: No correlation (no relationship between the rankings)
Assumptions:
The data should be ordinal, i.e., their values represent ranks or positions.
The relationship between the variables should be monotonic, i.e., as one variable increases, the other variable either consistently increases or decreases.
Advantages:
More robust to outliers and missing data compared to Pearson's correlation coefficient.
Can be used for non-parametric data, where the assumption of normality is not met.
Disadvantages:
Less powerful than Pearson's correlation coefficient for detecting linear relationships.
Does not provide information about the slope or intercept of the relationship, unlike Pearson's correlation coefficient.
Applications:
Exploring relationships between ordinal variables in fields such as psychology, education, and social sciences.
Assessing the agreement between rankings or scores.
Identifying variables that are related without making assumptions about their distributions.
Example 1:Spearman's Rank Correlation Coefficient (ρ)
Spearman's rank correlation coefficient (ρ) is a non-parametric measure of the monotonic relationship between two variables. It measures the degree to which the ranks of one variable correspond to the ranks of another variable.
Consider the following data on the heights and weights of 10 individuals:
| Individual | Height (cm) | Weight (kg) |
|---|---|---|
| 1 | 175 | 70 |
| 2 | 180 | 75 |
| 3 | 165 | 65 |
| 4 | 170 | 72 |
| 5 | 185 | 80 |
| 6 | 172 | 68 |
| 7 | 168 | 63 |
| 8 | 183 | 78 |
| 9 | 178 | 73 |
| 10 | 174 | 69 |
Step 1: Rank the variables
Rank the values of each variable separately, from smallest to largest.
| Individual | Height Rank | Weight Rank |
|---|---|---|
| 1 | 8 | 10 |
| 2 | 9 | 7 |
| 3 | 5 | 5 |
| 4 | 6 | 8 |
| 5 | 10 | 9 |
| 6 | 7 | 6 |
| 7 | 4 | 3 |
| 8 | 9 | 8 |
| 9 | 8 | 7 |
| 10 | 7 | 6 |
Step 2: Calculate the differences in ranks
For each individual, calculate the difference between the height rank and the weight rank.
| Individual | Height Rank - Weight Rank |
|---|---|
| 1 | -2 |
| 2 | 2 |
| 3 | 0 |
| 4 | -2 |
| 5 | 1 |
| 6 | 1 |
| 7 | 1 |
| 8 | 1 |
| 9 | 1 |
| 10 | 1 |
Step 3: Square the differences
Square the differences calculated in Step 2.
| Individual | (Height Rank - Weight Rank)^2 |
|---|---|
| 1 | 4 |
| 2 | 4 |
| 3 | 0 |
| 4 | 4 |
| 5 | 1 |
| 6 | 1 |
| 7 | 1 |
| 8 | 1 |
| 9 | 1 |
| 10 | 1 |
Step 4: Calculate the sum of the squared differences
Sum the squared differences calculated in Step 3.
Σ(Height Rank - Weight Rank)^2 = 20
Step 5: Calculate ρ
The Spearman's rank correlation coefficient is calculated as:
ρ = 1 - (6Σd^2) / (n^3 - n)
where:
d is the difference in ranks
n is the number of observations
In this example, n = 10.
ρ = 1 - (6 20) / (10^3 - 10) = 1 - 120 / 990 = 0.88
Interpretation:
The Spearman's rank correlation coefficient for this data is 0.88, which indicates a strong positive correlation between height and weight. It means that individuals with higher heights tend to have higher weights.
....................................................................................................
👉 For the data analysis, please go to my Youtube(Ads) channel to Watch Video (Video Link) in
Youtube Channel (Channel Link) and Download(Ads) video.
💗 Thanks to Subscribe(channel) and Click(channel) on bell 🔔 to get more videos!💗!!
- Tell: (+855) - 96 810 0024
- Telegram: https://t.me/sokchea_yann
- Facebook Page: https://www.facebook.com/CambodiaBiostatistics/
- TikTok: https://www.tiktok.com/@sokcheayann999
- STATA for dataset restructuring, descriptive and analytical data analysis
- SPSS for dataset restructuring, data entry, data check, descriptive, and analytical data analysis
- Epi-Info for building questionnaires, data check, data entry, descriptive, and analytical data analysis
- Epidata-Analysis for dataset restructuring, descriptive and analytical data analysis
- Epi-Collect for building questionnaires, remote data entry, mapping, and data visualization
- Epidata-Entry for building questionnaires, data check, data entry, and data validation
ABA Account-holder name: Sokchea YAN
ABA Account number: 002 996 999
ABA QR Code:
or tap on link below to send payment:
https://pay.ababank.com/iT3dMbNKCJhp7Hgz6
✌ Have a nice day!!! 💞


Comments
Post a Comment