Effect Size


In statistics, effect size is a measure of the magnitude of a phenomenon or treatment effect. It indicates the strength of the relationship between two variables or the impact of an intervention.
Types of Effect Size
There are several different types of effect size measures, including:
Standardized Mean Difference (Cohen's d): Compares the means of two groups standardized by the pooled standard deviation.
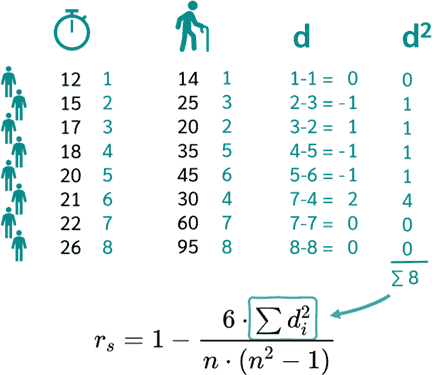
Correlation Coefficient (Pearson's r, Spearman's rho): Measures the strength and direction of the linear relationship between two variables.
Odds Ratio and Relative Risk: Measures the association between exposure and an outcome in epidemiological studies.
Partial Eta Squared: Represents the proportion of variance in the dependent variable explained by a specific factor or treatment.
Importance of Effect Size
Effect size is important for a number of reasons:
Complements statistical significance: Significance testing only indicates whether a result is statistically different from chance, but it does not provide information about its magnitude. Effect size measures quantify the strength of the effect.
Compares different studies: Effect size allows researchers to compare the results of different studies, even if they used different sample sizes or methodologies.
Guides sample size calculations: Effect size estimates can be used to determine the appropriate sample size for future studies.
Supports clinical interpretation: In medical research, effect size can help clinicians assess the practical significance of a treatment or intervention.
Interpretation of Effect Size
The interpretation of effect size depends on the specific measure used and the context of the research. However, general guidelines suggest:
Small Effect Size: 0.2 or less
Medium Effect Size: 0.5 or less
Large Effect Size: 0.8 or more
P-value vs Effect size
P-value
Measures the likelihood of obtaining the observed results assuming the null hypothesis is true.
Indicates statistical significance, but does not quantify the magnitude of the effect.
A low p-value (<0.05) suggests that the observed results are unlikely to have occurred by chance alone.
Effect size
Measures the magnitude of the observed effect.
Provides a quantitative measure of how much the results deviate from the null hypothesis.
Can be expressed as a difference between means, a correlation coefficient, or a regression coefficient.
Differences
Statistical significance: P-value indicates statistical significance, while effect size does not.
Magnitude of effect: P-value does not measure the magnitude of the effect, while effect size does.
Interpretation: P-values alone can be misleading, as a statistically significant result does not necessarily imply a meaningful effect. Effect sizes provide a more informative interpretation of the results.
Importance
Both p-values and effect sizes are important for evaluating research findings:
P-value: Ensures that the results are not due to chance alone.
Effect size: Provides a meaningful measure of the effect and helps determine its practical significance.
Considerations
The choice of p-value threshold (e.g., 0.05) is arbitrary and can affect the results.
Effect sizes can vary depending on the sample size and the research design.
Both p-values and effect sizes should be considered together for a comprehensive evaluation of research findings.
"Effect size helps readers understand the magnitude of differences found, whereas statistical significance examines whether the findings are likely to be due to chance. Both are essential for readers to understand the full impact of your work. Report both in the Abstract and Results sections"
Example 1:
Suppose a researcher conducts a study comparing two teaching methods. The study finds a statistically significant difference between the two methods, with students in the experimental group performing better than students in the control group. The standardized mean difference (Cohen's d) is 0.6.
This effect size would be considered a medium effect size, indicating a moderate difference between the two teaching methods. It suggests that the experimental method may have had a noticeable impact on student performance.
......................................................................................................
👉 For the data analysis, please go to my Youtube(Ads) channel to Watch Video (Video Link) in
Youtube Channel (Channel Link) and Download(Ads) video.
💗 Thanks to Subscribe(channel) and Click(channel) on bell 🔔 to get more videos!💗!!
- Tell: (+855) - 96 810 0024
- Telegram: https://t.me/sokchea_yann
- Facebook Page: https://www.facebook.com/CambodiaBiostatistics/
- TikTok: https://www.tiktok.com/@sokcheayann999

- STATA for dataset restructuring, descriptive and analytical data analysis
- SPSS for dataset restructuring, data entry, data check, descriptive, and analytical data analysis
- Epi-Info for building questionnaires, data check, data entry, descriptive, and analytical data analysis
- Epidata-Analysis for dataset restructuring, descriptive and analytical data analysis
- Epi-Collect for building questionnaires, remote data entry, mapping, and data visualization
- Epidata-Entry for building questionnaires, data check, data entry, and data validation
ABA Account-holder name: Sokchea YAN
ABA Account number: 002 996 999
ABA QR Code:

or tap on link below to send payment:
https://pay.ababank.com/iT3dMbNKCJhp7Hgz6
✌ Have a nice day!!! 💞


Comments
Post a Comment