Pearson Correlation Coefficient
Pearson Correlation Coefficient


The Pearson correlation coefficient (PCC), also known as Pearson's r, is a statistical measure that quantifies the linear correlation between two quantitative variables. It is a dimensionless value that ranges from -1 to 1.
Formula:
r = (Σ(x - x̄)(y - ȳ)) / √(Σ(x - x̄)² Σ(y - ȳ)²)
where:
x and y are the data points in the two variables
x̄ and ȳ are the means of the two variables
Σ is the summation operator
Interpretation:
r = 1: Perfect positive linear correlation (as one variable increases, the other increases linearly)
r = -1: Perfect negative linear correlation (as one variable increases, the other decreases linearly)
r = 0: No linear correlation (there is no evident relationship between the two variables)
0 < |r| < 1: Strength of correlation between weak and strong, depending on the value of r
Applications:
Measuring the relationship between two variables, such as income and happiness or test scores and grades
Determining if two variables are significantly correlated, using a statistical test
Identifying trends or patterns in data
Making predictions or inferences about one variable based on the other
Assumptions:
For the PCC to be valid, the following assumptions must be met:
The data should be normally distributed or approximately normally distributed.
The relationship between the variables should be linear.
The data points should be independent of each other.
Limitations:
The PCC only measures linear relationships.
It is not robust to outliers or non-normal data.
It can be misleading if the relationship between the variables is nonlinear or non-monotonic.
Related Measures:
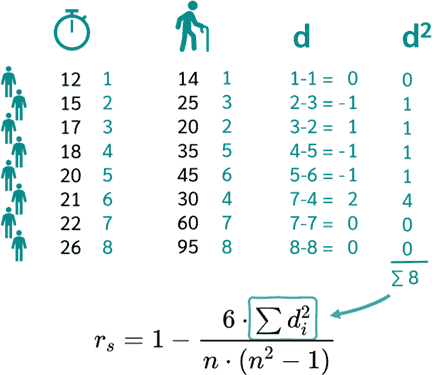
Spearman's rank correlation coefficient: Non-parametric measure for relationships between ordinal or non-normal data.
Kendall's tau correlation coefficient: Non-parametric measure for relationships between ordinal data.
example of The Pearson correlation coefficient
Pearson Correlation Coefficient
Formula:
r = (Σ(x - x̄)(y - ȳ)) / √(Σ(x - x̄)²Σ(y - ȳ)²)
where:
r is the Pearson correlation coefficient
x and y are the variables being correlated
x̄ and ȳ are the means of x and y, respectively
Σ represents the sum of the values
Example:
Suppose we have the following data:
| X | Y |
|---|---|
| 1 | 2 |
| 3 | 4 |
| 5 | 6 |
| 7 | 8 |
| 9 | 10 |
Calculate the Pearson correlation coefficient:
1. Find the means of x and y:
x̄ = (1 + 3 + 5 + 7 + 9) / 5 = 5
ȳ = (2 + 4 + 6 + 8 + 10) / 5 = 6
2. Calculate the deviations from the mean:
(x - x̄) | (y - ȳ)
------|------
-4 | -4
-2 | -2
0 | 0
2 | 2
4 | 4
3. Calculate the products of the deviations:
(x - x̄)(y - ȳ)
------
16
4
0
4
16
4. Calculate the sums of squares of deviations:
Σ(x - x̄)² = 40
Σ(y - ȳ)² = 40
5. Calculate the Pearson correlation coefficient:
r = (16 + 4 + 0 + 4 + 16) / √(40 40)
r = 40 / 40
r = 1
Interpretation:
The Pearson correlation coefficient in this example is 1, which indicates a perfect positive correlation between x and y. This means that as x increases, y also increases proportionally.
Example:
Research Question: Is there a relationship between blood sugar levels and body mass index (BMI)?
Data: A study is conducted on a group of 100 individuals, measuring their blood sugar levels (mg/dL) and BMI.
Pearson Correlation Coefficient Calculations:
1. Create a scatterplot to visualize the relationship between the two variables.
2. Calculate the mean and standard deviation for both blood sugar and BMI.
3. Determine the covariance between blood sugar and BMI.
4. Use the formula for Pearson correlation coefficient (ρ):
ρ = Cov(X, Y) / (SD(X) SD(Y))
where:
X: Blood sugar levels
Y: BMI
Cov(X, Y): Covariance between X and Y
SD(X): Standard deviation of X
SD(Y): Standard deviation of Y
Interpretation of Results:
The Pearson correlation coefficient ranges from -1 to 1.
A positive value indicates a positive correlation (as one variable increases, the other also increases).
A negative value indicates a negative correlation (as one variable increases, the other decreases).
A correlation coefficient near 0 indicates no significant relationship.
Example Results:
Let's say the Pearson correlation coefficient calculated for the blood sugar and BMI data is 0.65. This indicates a moderate positive correlation between the two variables. This means that individuals with higher BMI tend to have higher blood sugar levels.
Clinical Significance:
This correlation can be clinically significant as it suggests that obesity (high BMI) is a potential risk factor for developing high blood sugar levels and potentially type 2 diabetes.
.....................................................................................................
👉 For the data analysis, please go to my Youtube(Ads) channel to Watch Video (Video Link) in
Youtube Channel (Channel Link) and Download(Ads) video.
💗 Thanks to Subscribe(channel) and Click(channel) on bell 🔔 to get more videos!💗!!
- Tell: (+855) - 96 810 0024
- Telegram: https://t.me/sokchea_yann
- Facebook Page: https://www.facebook.com/CambodiaBiostatistics/
- TikTok: https://www.tiktok.com/@sokcheayann999

- STATA for dataset restructuring, descriptive and analytical data analysis
- SPSS for dataset restructuring, data entry, data check, descriptive, and analytical data analysis
- Epi-Info for building questionnaires, data check, data entry, descriptive, and analytical data analysis
- Epidata-Analysis for dataset restructuring, descriptive and analytical data analysis
- Epi-Collect for building questionnaires, remote data entry, mapping, and data visualization
- Epidata-Entry for building questionnaires, data check, data entry, and data validation
ABA Account-holder name: Sokchea YAN
ABA Account number: 002 996 999
ABA QR Code:

or tap on link below to send payment:
https://pay.ababank.com/iT3dMbNKCJhp7Hgz6
✌ Have a nice day!!! 💞


Comments
Post a Comment